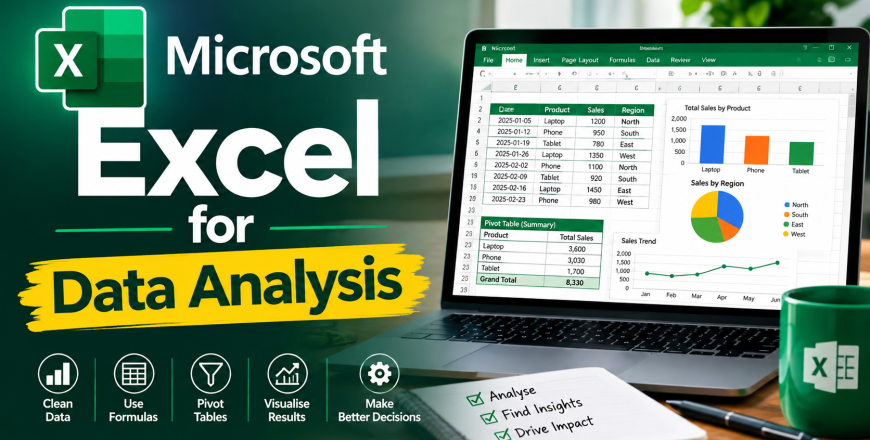
This is not just another Excel course. This is a practical, beginner-friendly Microsoft Excel for Data Analysis training designed to help you move beyond basic spreadsheets and learn how to use Excel to clean, analyse, visualise, and communicate data effectively.
You’ll learn how to transform raw and messy datasets into meaningful insights using Excel’s most important data analysis tools, functions, and techniques — while working through practical exercises and real-world business scenarios.
✔ A structured curriculum taking you from Excel fundamentals to confident data analysis
✔ Step-by-step lessons on data preparation, cleaning, transformation, analysis, and visualisation
✔ Practical training on Excel formulas and functions used in real-world data analysis
✔ Hands-on experience with PivotTables, PivotCharts, Excel Tables, filters, sorting, and conditional formatting
✔ Training on data cleaning and preparation using Power Query
✔ Practical exercises using sales, finance, customer, operations, and business datasets
✔ Guidance on choosing the right charts and visualisations to communicate insights effectively
✔ Real-world projects designed around practical business problems
✔ Portfolio-ready Excel projects that demonstrate your analytical skills
✔ Absolute beginners who want to learn data analysis using Excel
✔ Students and recent graduates looking to develop practical analytical skills
✔ Excel users who want to move beyond basic formulas and spreadsheets
✔ Aspiring Data Analysts and Business Intelligence professionals
✔ Professionals who need to analyse and report data in their current roles
✔ Freelancers, consultants, entrepreneurs, and business owners who work with business data
✔ Anyone looking to build a strong foundation in data analysis using Microsoft Excel
By the end of this training, you will be able to:
✔ Clean, organise, and prepare raw datasets for analysis
✔ Identify and handle missing values, duplicates, errors, and inconsistent data
✔ Use essential Excel formulas and functions to analyse data efficiently
✔ Apply sorting, filtering, conditional formatting, and data validation
✔ Create and work with Excel Tables and structured datasets
✔ Build powerful PivotTables and PivotCharts for summarising data
✔ Create professional and interactive Excel dashboards
✔ Select appropriate charts and visualisations to communicate findings
✔ Perform descriptive analysis using Excel, including mean, median, mode, percentages, and other key statistics
✔ Analyse trends, patterns, relationships, and business performance
✔ Use Power Query to clean and transform datasets efficiently
✔ Turn analytical findings into meaningful business insights and recommendations
✔ Present data clearly to support data-driven decision-making
✔ Build practical, portfolio-ready Excel data analysis projects
Throughout the training, you’ll develop practical skills in:
Data Cleaning → Excel Functions → Data Transformation → Descriptive Analysis → PivotTables → Data Visualisation → Dashboards → Power Query → Insight Generation → Business Reporting
By the end of the course, you won’t just know how to use Excel — you’ll know how to use Excel as a powerful tool for analysing data, uncovering insights, and solving real-world business problems.